Silvana Belalcazar 1, Erika Jazmín Acosta 2, John Jairo Medina-Murillo , Silvana Belalcazar 1, Erika Jazmín Acosta 2, John Jairo Medina-Murillo , Mercedes Salcedo-Cifuentes 4
1 Microbiologist at Fundación Hospital San Pedro. San Juan de Pasto, Colombia. ORCID iD: https://orcid.org/0000-0001-9561-9364. Email silvana.belelcazar@correounivalle.edu.co. Cellphone 3122981475.
2 Microbiologist at Hospital de Ipiales. Ipiales, Colombia. ORCID iD: https://orcid.org/0000-0003-2220-6854. Email. laboratorioipsmunicipal@hotmail.com. Cellphone 3136150321.
3 Statistician. Master’s degree in Epidemiology. Universidad Antonio Camacho Perea. Santiago de Cali, Colombia. ORCID iD: https://orcid.org/0000-0003-0808-8716Email jhonjai24@gmail.com. Cellphone 3185217039.
4 Microbiologist. Specialist in Quality. Master’s degree in Epidemiology. PhD in Biomedical Sciences. Universidad del Valle, Faculty of Health. Santiago de Cali, Colombia. ORCID iD: https://orcid.org/0000-0002-9681-6893. Email mercedes.salcedo@correounivalle.edu.co. Cellphone 3116170746.
Send correspondence to Mercedes Salcedo-Cifuentes: Email: mercedes.salcedo@correounivalle.edu.co. Universidad del Valle, Faculty of Health. San Fernando campus. Calle 4B N° 36-00, Edificio 134. Phone +57 2 558 1929. Cellphone 3116170746.
Archivos de Medicina (Manizales) Volumen 20 N° 1, Enero-Junio 2020, ISSN versión impresa 1657-320X, ISSN versión en línea 2339-3874, Belalcazar S., Acosta E.J., Medina Murillo J.J., Salcedo Cifuentes M.
Recibido para publicación: 18-10-2019 - Versión corregida: 04-12-2019 - Aprobado para publicación: 14-12-2019
Belalcazar S, Acosta EJ, Medina-Murillo JJ, Salcedo-Cifuentes M. Conventional biomarkers for cardiovascular risks and their correlation with the castelli risk index-indices and tg/hdl-c. Arch Med (Manizales) 2020; 20(1):11-22. DOI: https://doi.org/10.30554/archmed.20.1.3534.2020
Objective: to evaluate the correlation between a group of conventional biomarkers of cardiovascular risk with the Castelli-I and Castelli-II indices, and TG/HDL-C ratio in patients assigned to a program of cardiovascular risk for users of the clinical laboratory service of an institution that provides health services in the southwest of the Colombia. Materials and Methods: retrospective, descriptive multivariate exploratory study, carried out in 2 126 patients. Some sociodemographic variables were analyzed, as well as glucose and lipid profile. The Castelli-I and Castelli-II indices, and TG/HDL-C ratio were calculated. The correlation among the variables was evaluated through a matrix of correlations, the correlation index and the Bartlett’s Test of Sphericity. The analysis ended with a study of main components, which allowed to identify how the variables studied were grouped into components that characterized the population. Results: the average age was 56 ± 11 years; 68.7% were women; 48% hypercholesterolemic and 49% hypertriglyceridemic; 22% with alterations in glucose. Total cholesterol correlated positively with LDL-C and triglycerides negatively with HDL-C. Two components characterized the population, one related to cardiovascular risk and the other to lipid alterations. Conclusions: conventional biomarkers reveal high prevalences in dyslipidemias, in contrast to atherogenic indices. The results highlight the importance of considering the evaluation of these indices in primary care and the need to strengthen the measurement systems of clinical laboratories for the reliability of the data on which decisions are made for the management of these patients.
Keywords: risk factors, chronic disease, cardiovascular diseases, dyslipidemias.
Objetivo: evaluar la correlación entre un grupo de biomarcadores convencionales de riesgo cardiovascular con los índices de Castelli-I, Castelli-II y TG/cHDL en pacientes de riesgo cardiovascular usuarios del servicio de laboratorio clínico de una institución prestadora de servicios de salud del suroccidente de Colombia. Materiales y Métodos: estudio retrospectivo, descriptivo multivariado exploratorio, llevado a cabo en 2 126 pacientes. Se analizaron algunas variables sociodemográficas, glucosa y perfil lipídico. Se calcularon los índices de Castelli I/II y el índice de TG/cHDL. La correlación entre las variables se evaluó a través de una matriz de correlaciones, el índice de correlación y el Test de Esfericidad de Bartlet. El análisis finalizó con un estudio de componentes principales que permitió identificar como se agrupaban las variables estudiadas en componentes que caracterizaban a la población. Resultados: la edad promedio fue de 56±11 años, 68,7% fueron mujeres; 48% hipercolesterolemicos y 49% hipertrigliceridemicos; 22% con alteraciones en la glucosa. El colesterol total correlacionó positivamente con cLDL y los triglicéridos negativamente con cHDL. Dos componentes caracterizaron la población, uno relacionado con el riesgo cardiovascular y otro con las alteraciones lipídicas. Conclusiones: los biomarcadores convencionales develan altas prevalencias en las dislipidemias en contraste con los índices aterogénicos. Los resultados resaltan la importancia de considerar la evaluación de estos índices en atención primaria y la necesidad de fortalecer los sistemas de medición de los laboratorios clínicos para la confiabilidad de los datos sobre los cuales se toman decisiones en el manejo de estos pacientes.
Palabras clave: factores de riesgo, enfermedad crónica, enfermedad cardiovascular, dislipidemias.
Dyslipidemia is a single major risk factor for the development of future cardiovascular events, including coronary heart disease, myocardial infarction, stroke and peripheral vascular disease [1,2]. Today, this group of diseases is not only a public health problem for developed countries but also for low and middle income countries. Estimates made in 2010 showed that in countries with emerging economies, 80% of deaths were due to cardiovascular diseases (CVD) [3]. Therefore, monitoring the balance of lipid fractions through the lipid profile constitutes a preventive measure of relevance in the management of patients at high cardiovascular risk [4].
The control of dyslipidemia as a follow-up strategy in CVD control programs includes the determination of triglyceride (TG) levels, low density lipoproteins (LDL-C), high-density lipoproteins (HDL-C) and total cholesterol (TC); with an emphasis on LDL-C levels, since it is considered as a ‘bad’ or risky lipoprotein [5]. However, studies have shown that when these conventional lipid parameters remain apparently normal or moderately high, lipid relationships such as the Castelli risk indices I (TC/HDL-C) and II (LDL-C/HDL-C), and the TG/HDL-C ratio are diagnostic alternatives for the prediction of cardiovascular events [6-8]. The Castelli risk index-I (CRI-I), also known as cardiac risk ratio (CRR), reflects the formation of coronary plaques with a diagnostic value as good as the determination of total cholesterol [9,10]. On the other hand, the Castelli risk index-II (CRI-II) has been shown to be an excellent predictor of cardiovascular risk [5] and, in relation to the TG/HDL-C ratio, it has correlated quite well with insulin resistance [11], as well as with the prediction of acute myocardial infarction (AMI) [12].
About 50% of patients with type-2 diabetes present dyslipidemia [1,2]. This population, despite being under treatment with hypocholesterolemic drugs, maintain a residual cardiovascular risk associated with several factors, including the increase of TG, which leads to a decrease in HDL-C and an increase in LDL-C.1 This imbalance among lipid fractions helps maintain an atherogenic environment in diabetic patients, in addition to the induction of non-response to insulin [13].
Publications in Colombia show that in the follow-up of non-communicable chronic diseases of public health interest, including CVD and their comorbidities, there are used the conventional lipid profile and glucose determination, among other parameters [13]. The model of comprehensive care for chronic noncommunicable diseases (ECNT) does not consider atherogenic indices, and there were not found studies that evaluated the contribution of these indices to the management of patients with these chronic diseases. Therefore, the objective of this study was to evaluate the correlation between conventional cardiovascular risk biomarkers with the Castelli risk index-I, Castelli risk index-II and TG/HDL-C indices in older people to a program of cardiovascular risk for users of the clinical laboratory service of an institution that provides health services (IPS, for its initials in Spanish) in the southwest of the country.
Type of study, population and sample
This was a retrospective descriptive study with multivariate exploratory analysis, which was carried out in a municipality in southwest Colombia. The population corresponded to members of the urban and semi-urban community assigned to the cardiovascular risk program (CVR). The sample included the total of patients who underwent a whole blood sample for a single time during the study period (2015-2016) to determine the lipid profile and glucose determinations.
Study variables
Three groups of variables were considered: 1) sociodemographic (age, sex, ethnicity and the health promotion company-EPS-); 2) paraclinical tests, which included Total Cholesterol-TC- (mg/dL), High-density cholesterol-HDL-C (mg/dL), Low-density-cholesterol-LDL-C (mg/dL), Triglycerides-TG- (mg/dL) and Glucose-GLU- (mg/dL) and 3) a group of atherogenic indices calculated from the lipid fractions, among them Castelli risk index-I (TC/HDL-C), Castelli risk index-II (HDL-C/LDL-C) and TG/HDL-C. The risk cut-off points for each of the conventional serum biomarkers examined were: High TC (>200 mg/dL); low HDL-C (<40 mg/dL); high TG (>150 mg/dL) and high GLU (>125 mg/dL). The cut-off values for each index considered as risky were: Castelli risk index-I (TC/HDL-C) ≥5.0, Castelli risk index-II (HDL-C/LDL-C) ≥3.0 and TG/HDL-C ≥ 3.0 (10). The average age considered as risky for both men and women was ≥60 years.
Data analysis
All the statistical analyses were carried out in XLSTAT-Premium version [14] for Windows 2010. The normality of the variables was evaluated through the Shapiro Wilk Test. For qualitative variables ratios and proportions were calculated with 95 confidence intervals. For quantitative variables measures of central tendency and dispersion were calculated. The differences among quantitative measures were evaluated through the Two-Tailed Median Test and Chi-square, considering a p value ≤0.05 as statistically significant. The collinearity among the variables was evaluated through a dispersion matrix, the correlation index and the Bartlett’s Test of Sphericity [15]. The data were finally processed through a multivariate exploratory principal component analysis (PCA). The number of selected components was estimated considering a variance ≥ 60%, the sedimentation graph and the eigenvalue criterion [16].
Ethical considerations
The protocol was approved by the high managers of the IPS source of information, which according to Resolution 8430 of 1993 of the Ministry of Health of Colombia, is a “risk-free research.” The information was extracted from the information system of the clinical laboratory of the IPS source of information, which is located in a municipality in southwestern Colombia, without violating the principle of patient confidentiality.
The study included 2 126 patients treated between 2015 and 2016. 68.7 % were female, so there was a proportion of 3 women for every man. The average age was 56 ± 11 for women (range 23-95 years), and 58 ± ١١ for men (range 40-85 years). According to their health insurance status and affiliation to the health system (EPS), 1 198/2 126 (IC95% 54.2-58.5%) were covered by the subsidized regime, 278/2 126 (IC95% 11.6-14.5%) contributed to the health system, 639/2 126 (CI95% 28.1-32.0%) were affiliated to an indigenous population health provider, and 11 patients were not coverage by any EPS.
None of the analytical biochemical markers presented a normal distribution (Shapiro Wilk test, p=0.0001). No statistically significant differences were observed in the distribution of conventional serum biomarkers by sex, except for HDL-C levels (Median Test, p=0.0000). Based on the cut-off points of the serum biomarkers of the lipid profile, hypercholesterolemia and hypertriglyceridemia were present in 48% and 49% of individuals, respectively. The relationship between serum biomarkers was explored in patients who came from both standard EPSs and an EPS for indigenous populations; no statistically significant results were found (Chi-square test, p=0.05). The global dyslipidemia evaluated by the TC/HDL cholesterol index was 14.5%, and the HDL-C/LDL-C ratio was 15.1%. Alterations in the TG/HDL-C index and high GLU levels occurred in 3.4% of patients, without statistically significant differences when compared with patients who had normal or modernly high GLU levels. A summary of the descriptive statistics of the biomarkers evaluated in this study is presented in Table 1.
Table 1. Serum biochemical parameters and atherogenic indexes that were evaluated according to the risk age range. Source: database. Own elaboration
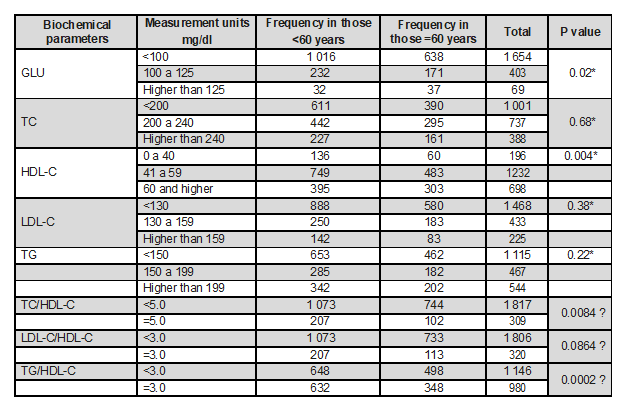
*Median Test. Ɛ Chi square Test. GLU: glucose, TC: total cholesterol, TG: triglycerides.
The atherogenic indices did present a normal distribution (Shapiro Wilk test, p=0.0001) and, like the serum biomarkers, there were no significant differences between patients in the EPS for indigenous populations and those from other EPSs. On the other hand, 5% of older adults with GLU results above 125 mg/dL had a risk factor for their TG/HDL-C index, that is, ≥3.0. A summary of the distribution of the averages of these atherogenic indices by age and sex range is presented in Table 2.
Table 2. Calculated atherogenic indices, discriminated by risk age and sex
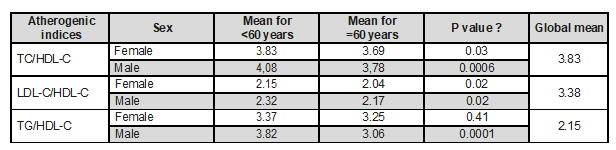
Source: database. own elaboration. Ɛ Chi square Test
The correlation matrix (Figure 1) showed that GLU was not correlated with any of the variables included in the study, except for the age variable (R=0.774). In contrast, TC showed a strong correlation with the lipid fraction LDL-C (R=0.775) and low with HDL-C (R=0.231) as well as with TG levels (R=0.302). Median Test. Ɛ Chi square Test. GLU: glucose, TC: total cholesterol, TG: triglycerides.
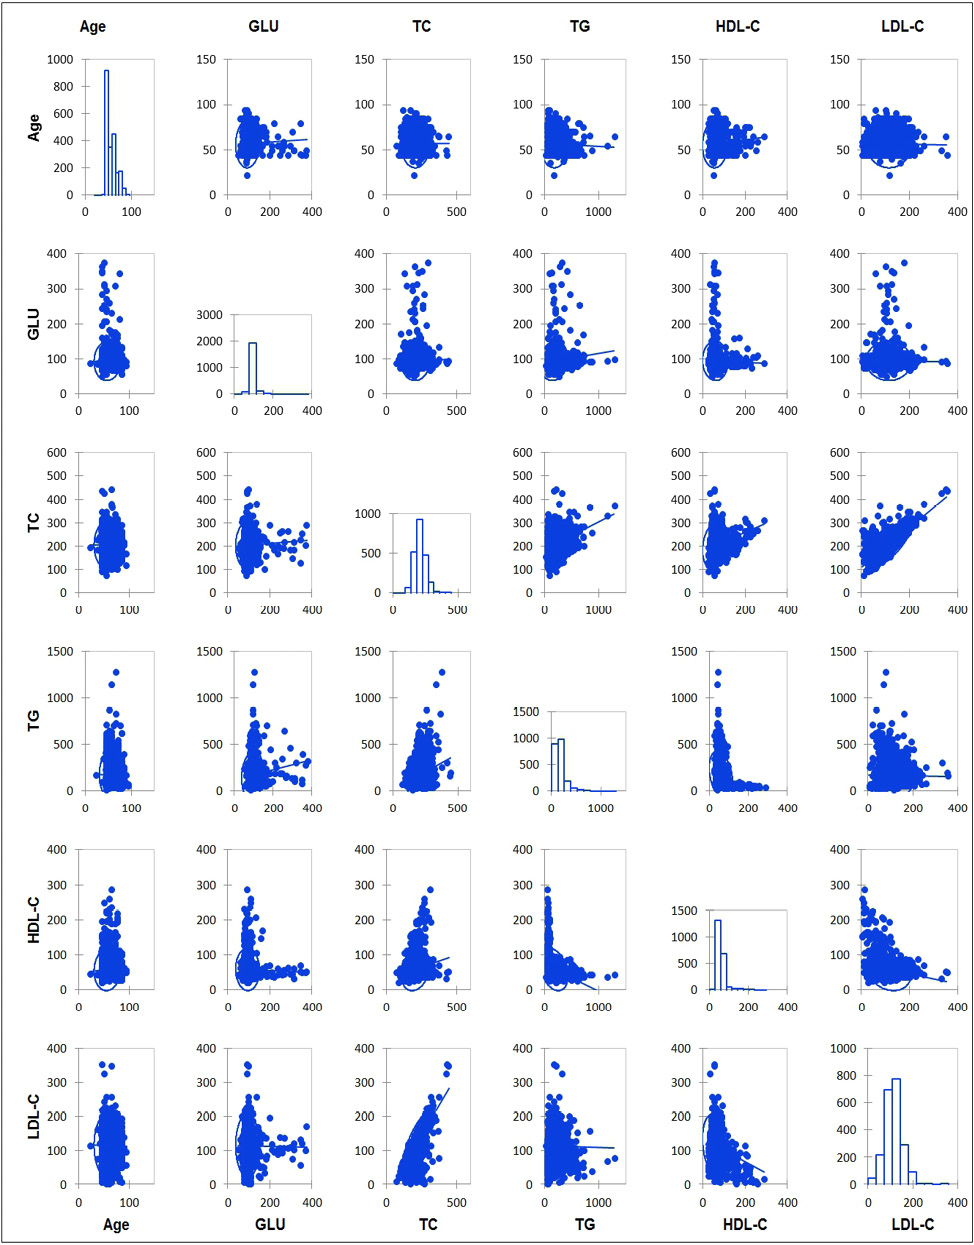
Figure 1. The correlatin matrix between the study variables. Source: database. own elaboration.
The Bartlett’s Test of Sphericity confirmed the correlation between the variables (p=0.0001). The variables included in each component and the contribution of each to the total variance is presented in Table 3.
Table 3. Absolute contribution of the variables to the components. The variables of each component are underlined within the table
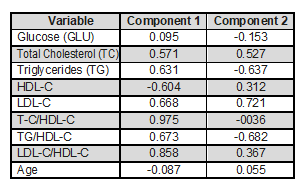
It has been underlined the location of the variable in the component.
Source: database. own elaboration.
According to the extraction of the main components (MC), the first component explained 41% and the second one 21.2% of the variability. In general, the PCA showed two components that accounted for 62.2% of the total variance. A graphic summary of the contributions of the variables to each component is presented in Figure 2. Age, total cholesterol and the three atherogenic indices evaluated in the study were located in component 1 (axis “X”). These were the predictive component of CVD. All of them showed to be significant, since they were located close to the unit circle, except for the age variable. On the “Y” axis, on which component 2 was structured, the relationship between TG levels, the two most important fractions of total cholesterol, HDL-C and LDL-C, and GLU was shown; these factors as a whole reflect the presence of dyslipidemia. The HDL-C, LDL-C and TG fractions were significant, but not GLU.
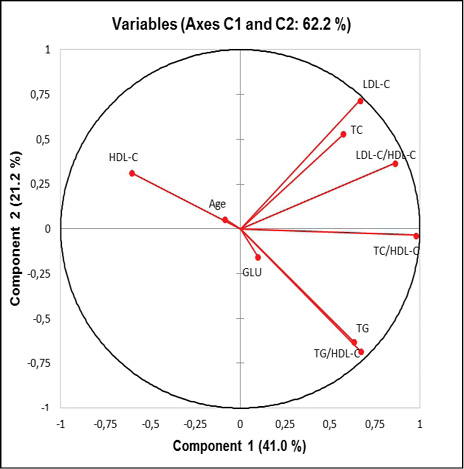
Figure 2. Distribution of the variables according to the factorial plane of the two selected components. Depending on the characteristics of the variables, it has been defined the “X” component as the risk predictor, and the “Y” axis as the alteration component.
Source: database. Own elaboration.
Studies in Colombia have established the balance of conventional serum biomarkers used for the control of patients [16-20] with CVR, but not the correlation of these with the atherogenic indices evaluated in this study. Using the principal component analysis method (PCA), it was possible to identify, in an exploratory way, how this set of risk markers is related to older adults who belong to the CVR program of an IPS from the southwestern Colombia, and who are users of its clinical laboratory.
The results showed a higher prevalence of women older than 50 years, who in a low proportion are attended through an EPS for indigenous people, and with a significant association between their glucose levels and HDL-C. In this regard, there is increasing evidence of gender and sex differences in the epidemiology, pathophysiology, treatment and outcomes in chronic noncommunicable diseases. Gender differences are factors associated with sociocultural processes, such as different behaviors between women and men, exposure to specific environmental influences, different forms of nutrition, lifestyles or stress. On the other hand, the sex factors refer to the variables linked to the difference in the biology between women and men that originate in their gene pool, the sex hormones and their effects on the organs and systems that vary in the life cycle of the woman [21,22]. According to the results of these studies, women have a higher prevalence of chronic comorbidities, including dyslipidemias, type-2 DM and atherogenesis [23]. In the study by Kautzky-Willer et al, 2 016 [23], older women were notorious because they present hormonal changes that affect the balance of lipoproteins and carbohydrates [24]. However, these results may also show that women adhere better to treatment and control programs [23]. They may also point out that in the municipality where the information source institution is located, the highest prevalence of CVR occurs in women. This situation cannot be ignored since the study was carried out with the hospital records of a second level IPS belonging to the public health network of the municipality; which is used by a high proportion of inhabitants of the urban and semi-urban areas, where they receive comprehensive care, medical management, treatment and diagnostic or follow-up services by the clinical laboratory. In fact, the National Health Observatory presented for that municipality a CVD mortality rate during 2011 that is more prevalent in women, and which dramatically increased in those aged over 50 years [25].
Several studies have indicated a significant relationship between the metabolism of lipids and carbohydrates, which, in turn, are related to age [16,26,27]. As age increases, so does the prevalence of hypercholesterolemia, hypertriglyceridemia and hyperglycemia. Those results were similar to the ones in this study, in which statistically significant associations were identified between age and levels of GLU and HDL cholesterol. However, the relationship between TG and GLU [16,28] and between high levels of LDL-C and increased glucose was not present [29], probably due to a selection bias, taking into account that they were patients who go to the clinical laboratory service for periodic controls of their TG, HDL-C and GLU levels, which together with other paraclinical tests constitute the routine examinations of the CVR program. On the other hand, although alterations in lipoprotein metabolism occur in 50% of cases in CVD, there is consensus that its evaluation based exclusively on the determination of low density lipoprotein cholesterol (LDL-C) is not the best choice [30].
Hence the importance of monitoring with the group of biomarkers defined in most CVR care guidelines, but also considering new markers that improve risk prediction. In this study, the Castelli risk indexes I (TC/HDL-C) and II (LDL-C/HDL-C) were evaluated. They are very powerful risk indicators, which have a predictive value higher than the isolated data of the lipid profile for CVD, since they reflect the alteration of a very important component of vascular risk, the decrease in the levels of the protective cholesterol fraction, HDL-C, at the expense of the increase of TC and specifically the risk fraction, LDL-C [31]. The results obtained in this study showed how the two indicators differed statistically according to sex and age, in contrast with the results of the lipoprotein fractions when they were individually reported, in which case only two serum biomarkers showed statistically significant differences by age. The importance of the Castelli risk index-I lies in the fact that it is the indicator that overlaps the least between populations of individuals with or without CVR, with a normal or relatively high lipoprotein balance [32]. This was observed in the results of this study, which showed a high prevalence of hypercholesterolemia and hypertriglyceridemia using the cut-off points of TC and TG, in contrast with the risk cut-off points of Castelli I and II risk indices, with which the prevalence of alterations of lipoprotein fractions decreased by almost 50%.
In relation to the TG/HDL-C index, this evaluates the risk of developing insulin resistance. This indicator identified a low proportion of diabetic patients who had a high risk of developing or who already presented insulin resistance, data that could not be confirmed since there was no clinical information of the patients included in the study, only the antecedent of being assigned to the CVR program. In addition, this result gives evidence of a good control of the patients assigned to the program, since other studies, such as that of Hernández-Vite et al, 2 015 [33], showed a significant association between the TG/HDL-C index and high fasting GLU levels. This predictive value of the TG/HDL-C ratio represented an opportunity for the health system to improve the early diagnosis of insulin resistance in diabetic patients with high CVR, as well as a reduction in institutional costs, and an improvement in the access to the diagnoses that are provided by the IPSs. Here, it is important to highlight the importance achieved by the clinical laboratory service, by guaranteeing the reliability of the measurements of these routine exams, since they give rise to atherogenic indices that are discriminant and predictive of risks [34-36].
On the other hand, the results of the exploratory multivariate study (PCA) showed two groups of well-differentiated variables, one predictor of CVD and another related to lipid imbalance. In this last point, recent studies show that changes in lipids can not only be a consequence of the altered metabolism of GLU but also a cause of them. Hypertriglyceridemia and low HDL-C, most of the times, have a significant association with diabetes. This was evidenced in the results of the main component chart, in which it was observed the distribution of the TG data in a plane opposite to the data of the HDL-C levels. However, taking into account that the proportion of diabetics was less than 5% in the sample, the GLU data were not significant and their low contribution to variability was observed due to their position in the graph, close to the origin of the data. This is the reason why it was decided to include the GLU variable in the exploratory multivariate model, since biological plausibility and the background of previous studies were considered more relevant than statistical significance. In addition, it was observed that by eliminating the variable, the final variability decreased by almost 10%.
The increase in TG is associated with an increase in the levels of free fatty acids that can induce insulin resistance and β-cell dysfunction [37], apparently because, like GLU, free fatty acids are important determinants of the balance of β cells [38]. This relationship between lipid metabolism and carbohydrate metabolism is clinically relevant, since it explains why the balance of GLU levels is affected in hypertriglyceridemic patients.
At international level, there are some studies that have assessed the differences between the levels of TC, LDL-C, HDL-C, TG and GLU in minority groups. Although the results of this study did not show statistical significance when comparing the results of conventional serum biomarkers and atherogenic indices in the elderly served by an EPS for indigenous people, compared with those who are not, due to the sample size, this risk factor should not be underestimated, especially in populations where it is known that there are settlements of indigenous communities, as it is the case of the municipality where the data from this investigation came from, because the results have not been conclusive in this regard. For example, Ariel et al, 2014 [39], in their study concluded that minority groups, except African Americans, were more likely to have high dyslipidemia, with a marked alteration in the TG/HDL-C ratio. However, they felt that more studies were needed in order to determine how ethnic differences in dyslipidemia affect cardiovascular disease rates. In the same sense, Joshua et al, 2011 [26], expressed that for the particular case of Hispanics, the decrease in HDL-C and an increase >2.0 in the TG/HDL-C ratio were not associated with MI risk. In addition, the distribution of results suggests the need to establish a limit different from the one established in the TG/HDL-C index in (for) this age group.
Conclusions
The data obtained in the study showed that the conventional biomarkers evaluated reveal prevalence in alterations of lipid fractions higher than those provided by atherogenic indices. On the other hand, atherogenic indices have a strong association with variables such as sex and age. The analysis model used could separate the characteristics of the lipid profile and the atherogenic index according to the underlying pathological condition, a variable that should be considered in future studies. Given that there are variations in lipid metabolism according to ethnicity, it is possible that there are also differences in the risk of CVD, which should be explored in Colombia, especially in those regions where there is a high density of communities of indigenous descent. Finally, although these findings highlight the importance of developing predictive and risk management guidelines to strengthen the CVR program at the primary care level, clinical laboratories need to strengthen quality assurance programs for measurements, since their results would be used indirectly with the calculation of these indices to improve the predictive capacity of risk.
Contribution of the authors
The research protocol and its design, data collection, statistical analysis, evaluation and interpretation of the data, critical analysis, discussion, writing and approval of the final manuscript were carried out by all authors who contributed in the same way in the whole process. The corresponding author represents the group of authors
Acknowledgments
To the Directive staff of the Institution that provides Health Services, which authorized the use of its databases and supported the development of this project.
Sources of financing: the economic source was provided by the authors.