Artículo de Investigación
Prediabetic state and dyslipidemia in freshmen in Health Sciences campus of a Mexican University
Ana Patricia González Ascencio 1, Juan Antonio Córdova 2,Crystell Guzmán Priego 3, Juan Manuel Munoz Cano 4
1. Nurse. Research Center in Health Sciences, Universidad Juárez Autónoma de Tabasco, México. Correo e.: patiascencio_92@hotmail.com
2. Engineer in computer science, PhD in education. Research Center in Health Sciences, Universidad Juárez Autónoma de Tabasco, México. Correo e.: juan.cordova@ujat.mx
3. Doctor, master’s degree in basic biomedical sciences. Research Center in Health Sciences, Universidad Juárez Autónoma de Tabasco, México. Correo e.: crystell_guzman@hotmail.com
4. Doctor, master’s degree in molecular biomedicine. Research Center in Health Sciences, Universidad Juárez Autónoma de Tabasco. México. Correo e.: juan.munoz@ujat.mx.
Archivos de Medicina (Manizales), Volumen 18 N° 2, Julio-Diciembre 2018, ISSN versión impresa 1657-320X, ISSN versión en línea 2339-3874. González Ascencio A.P., Cordova J.A., Guzmán Priego C., Muñoz Cano J.M.
Recibido para publicación: 10-02-2018 - Versión corregida: 25-10-2018 - Aprobado para publicación: 08-11-2018
González-Ascencio AP, Cordova JA, Guzmán-Priego C, Muñoz-Cano JM. Prediabetic state and dyslipidemia in freshmen in Health Sciences campus of a Mexican University. Arch Med (Manizales) 2018; 18(2):270-8. DOI: https://doi.org/10.30554/archmed.18.2.2777.2018.
Summary
Objective: given the dramatic increase of diabetes in the world, the objective of this research was to analyze the values of blood glucose in a university population again income to support strategies for detection and preventive management of pre-diabetes and diabetes. Materials and methods: this is an observational, analytical, cross-sectional, non-probabilistic study to analyze biochemical markers in two freshman populations in a School of Medicine, 367 students enrolled in 2011 and 430 enrolled in 2016. The study variables were glycemia, triglyceridemia, and cholesterolemia. Statistical measures of central tendency, dispersions, and correlations for the groups, and applied Chi-square to clinical categories was analiced. Results: it was found significant increases in women in glycemia between 2011 and 2016: t = -4.582 (p = 0.0001) and cholesterolemia t = -9.124 (p = 0.0001). Men had significant increases in glycemia with t = -6.428 (p = 0.0001) and cholesterolemia with t = -9.499 (p = 0.0001). There was a higher prevalence of prediabetes and total cholesterol in borderline levels and risks in the 2016-population. We found correlation in men and women regarding glucose-triglycerides, glucose-cholesterol, and cholesterol-triglycerides in both populations. Conclusions: in the sample of 2016 there was increase in young adults at risk of developing type 2 diabetes mellitus and atherosclerosis by what is needed to develop strategies to improve lifestyle.
Key words: hyperglycemia, prediabetic state, hypercholesterolemia, risk, youth.
Prediabetes y dislipidemia en estudiantes de Nuevo ingreso al campus de Ciencias de la Salud de una universidad Mexicana
Resumen
Objetivo: a nivel global se ha observado un desplazamiento hacia la derecha los promedios de glucosa y colesterol en sangre. Esto aumenta la probabilidad de desarrollar enfermedades no transmisibles. Por ello el objetivo fue analizar la prevalencia de anomalías en adultos jóvenes. Materiales y métodos: es un estudio observacional, analítico, transversal, no probabilistico. Se realizó en el Centro Clínico de una Escuela de Medicina en el sureste de México. Participaron poblaciones de nuevo ingreso a una facultad de medicina, 367 jóvenes en 2011, y 430 en 2016. Mediciones principales. Glucemia, trigliceridemia y colesterolemia en ayuno. Se analizaron estadísticos de tendencia central, dispersiones y correlaciones para los grupos. También Chi2 para categorías clínicas. Resultados: se encontraron incrementos significativos en mujeres de glucemia entre 2011 y 2016, t = -4.582 (p = 0.0001) y colesterolemia, t = -9.124 (p = 0.0001). Los hombres también tuvieron incrementos significativos en glucemia con t = -6.428 (p = 0.0001) y colesterolemia con t = -9.499 (p = 0.0001). Hubo mayor prevalencia de prediabetes y colesterol total en niveles mayores al deseable en la población de 2016. Se encontró correlación en mujeres y hombres entre glucosa-triglicéridos, glucosa-colesterol y colesterol triglicéridos en ambas poblaciones. Conclusiones: en 2016 hubo incremento en la proporción de individuos en riesgo de desarrollar diabetes de tipo 2 y aterosclerosis.
Palabras clave: hiperglucemia, estado prediabético, hipercolesterolemia, riesgo, jóvenes.
Introduction
In the second half of the XX century, an increase of non-communicable diseases (NCD) occurred, and was considered a pandemic. The load of these diseases also shows a dramatic increase in disability adjusted live years (DALYs). In Mexico, type 2 diabetes (T2DM) had a DALYs of 280,985 years in men, with a 98% increase in 2010, when 557,925 years with disability were calculated. For women, DALYs caused by T2DM were of 324,988 in 1990 and 526,724 in 2010 with a 57% increment [1]. However, this calculation considers the losses starting at the diagnosis of disease, which is often delayed [2]. The prevalence of people with a previous diagnosis of T2DM was of 7% in 2000, 7.2% in 2016, 9.2 in 2010, and 9.4% in 2016 [3].
The risk factors considered for the increase in the probability of premature death (between 30 and 70 years of age) due to NCD are overweight-obesity, hyperglycemia, arterial hypertension, low physical activity [4]. But these are effects and not the root cause of the problems. In this way, the Health Care System is oriented at palliating the consequences at the most when performing preventive medicine, and not in defining a strategy to attack the origin of the problem, which is shared with other NCD like atherosclerosis, stroke, hypertension, non-alcoholic liver cirrhosis, renal failure, various types of cancer [4-5].
Independently from the root causes, their consequences appear many years before diagnosing the disease. For example, for T2DM it is accepted that neuropathy appears 10 years before the diagnosis, as well as the hepatic alterations, kidney disease, and retinopathy. This occurs because the fundamental injury of this disease starts to be generated many years before the habitual diagnosis [2,6].
In the last decades, a continuous displacement has been observed of the biochemical markers values, like glucose in blood, in the worldwide population [7]. However, these are not the only ones to have been detected. Changes in triglycerides levels, total cholesterol [8], albumin-globulin relation, although within the desirable cut-off limits, represent a modification towards risk values for NCD. In Mexico, it was found that of the population that had undergone a previous measure of total cholesterol (44.5% of the adults of the survey) 20.8% had received the diagnosis of hypercholesterolemia [3].
The proportion of adolescents of 12 to 19 years with combined overweight and obesity was of 36.3% in 2012 and 34.9% in 2016. Although the dominant paradigm accepts that it starts with the increase in body mass, it has been found that this is not necessarily the process occurring in this region for the youngsters, because independence between the levels of glucose in blood and body mass values has been demonstrated in young people [9-10]. This means that overweight and obesity should not be a strict criterion for the measurement of glycemia in young patients without a previous diagnosis.
According to this, the objective of this research was to analyze the statistical data of the central tendency of the glycemia, triglyceridemia, and cholesterolemia in the population of new entrance to the campus of Health Sciences of a University of the Southeast of Mexico to sustain the need to increase the emphasis in Comprehensive strategies to decrease the chances of developing prediabetic state,T2DM and dyslipidemias.
Materials and methods
This is an observational, analytical, cross-sectional, prospective, non-probabilistic study. Among the requirements for new students entering the University, a clinical file is routinely prepared that is complemented by laboratory studies such as blood count and clinical chemistry, including fasting glucose. Although students can enroll in social security, this is intended to identify the health status of students to provide medical advice on college campuses during their school career.
Inclusion criteria were: 1) Freshman students, enrolling in Health Sciences in October 2011 and in October 2016. 2) Students had to accept to be taken a blood sample by the laboratory personnel of the Health Sciences Academic Division (DACS) for routine tests. Students with previous diagnosis of diabetes, hyperlipidemia, or pregnancy were excluded (Figure 1).
Study variables were glycemia, triglyceridemia, and cholesterolemia. Glucose was assessed according to the American Diabetes Association (ADA) criteria. Clinical criteria for fasting glucose were euglycemia when glucose ≤ 5.55 mmol/l, prediabetes state if glucose was 5.56 to ≤ 7 mmol/l, and diabetes if glucose was ≥ 7.1 mmol/l. To assess serum lipids, criteria of the National Cholesterol Program Adult Treatment Panel III, 2005, were used. Triglycerides (TG) were considered desirable at ≤ 1.68 mmol/l, borderline from 1.69 to 2.25 mmol/l, and high at ≥ 2.26 mmol/l. Total cholesterol (TC) values were considered desirable at ≤ 4.39 mmol/l, borderline from 4.40 to 5.16, and high at ≥ 5.17.
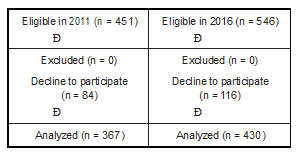
Figure 1. Study design. Eligible students were new entrants into attendance lists. Students can refuse to clinical chemistry analyses made. The results of the laboratory tests go to the Clinical Center of the unit where they serve to support medical and nutritional advice. Source: own data.
The personnel of the clinical analyses laboratory of the Tabasco’s Juarez Autonomous University (UJAT) obtained 12-hour fasting blood samples from the participants. Sterile equipment was used, blood was collected in Vacutainer® Serum tubes (Becton Dickinson, Franklin Lakes, NJ, USA). Glucose, triglycerides, and total cholesterol were measured by means of dry slide technology in automated equipment VITROS® 250 (Ortho-Clinical Diagnostics Johnson & Johnson, Rochester, NY, USA).
The October 2011 sample was obtained from 367 newly enrolled students at the Health Sciences Campus, 193 men, mean age of 18.1 (SD 0.9) years, and 174 women, mean age of 18.1 (SD 0.7) years. Likewise, the October 2016 sample was obtained from 430 newly enrolled students at the Health Sciences Campus, 120 men, mean age 18.75 (SD 0.9) years, and 310 women, mean age 18.5 (SD 0.7) years. The difference in enrollment was due to the creation of two new undergraduate study programs at the campus.
Bias control: Equipment was calibrated daily. On the possibility of a result out of range is repeated. Laboratory equipment were kept at constant temperature during the time of analysis of the samples.
Statistical analyses. IBM Statistics Package for the Social Sciences version 21.0 (SPSS, Chicago, IL, USA) was used for data processing. For data analyses, central tendency and dispersion descriptive statistics were used. Pearson test was used to compare intra-group variables. Student t-test was used to compare inter-group variables. Chi square was used to assess the difference in the proportion of prediabetes and hypercholesterolemia. Statistical significance was set at p ≤ 0.005. A box and whiskers plot was performed with the Minitab Statistical Software version 17.3.1 (Minitab Inc., State College, PA, USA).
Ethical considerations. This is a non-risk study and does not compromise data confidentiality of the participants. It complies with the guidelines of the Helsinki Declaration as revised in 2000.
Results
October 2011 sample. The sample of the 367 newly enrolled students, 174 women and 193 men, was analyzed. The mean glucose in women was 4.9 mmol/l (SD 0.45), and 4.9 mmol/l (SD 0.57) in men (Figure 2, panel A). Triglycerides, in women, were 1.3 (SD 0.65) mmol/L and 1.2 (SD 0.73) mmol/l in men (Figure 2, panel B). Total cholesterol, in women, was 3.9 (SD 0.85) mmol/l and 3.8 (SD 0.84) mmol/l in men (Figure 2, panel C).
In the 174 women, 163 (93.7%) were considered in euglycemia, 11 (6.3%) in prediabetes. About triglycerides, 139 women (79.9%) were considered within desirable values, 21 (12.1%) were borderline, and 14 (8%) high. Total cholesterol, 117 women (67.2%) in optimal values, 47 (27%) in mid values, and 19 (5.7%) in high.
In the 193 men, 168 (87%) were considered in euglycemia, 24 (12.4%) in prediabetes state, and 1 (0.5%) was considered diabetic. For triglycerides determination, 157 (81.3%) were within desirable values, 23 (11.9%) were borderline, and 13 (6.7%) high. For total cholesterol,146 (75.6%) were within desirable values, 33 (17.1%) were borderline, and 14 (7.3%) high.
Pearson test revealed a correlation, in women, glucose-triglycerides, r = 0.358 (p < 0.0001); glucose-total cholesterol, r = 0.458 (p < 0.0001); and triglycerides-cholesterol, r = 0.546 (p < 0.0001). In men, a correlation was found in glucose-triglycerides, r = 0.28 (p < 0.0001); glucose-total cholesterol, r = 0.384 (p = 0.0001); and triglycerides-total cholesterol, r = 0.500 (p < 0.0001). Student’s t-test did not reveal differences among values of glucose, triglycerides, and cholesterol between men and women of this group.
October 2016 sample. The results of 430 newly enrolled students, 310 women and 120 men were analyzed. The mean glucose was 5.2 mmol/L (SD 0.98) in women, and of 5.5 mmol/l (SD 1) in the 120 men (Figure 2, panel A), revealing glucose values close to the cut-off limits for prediabetes, ≤ 5.55 mmol/l. Triglycerides in women were 1.3 (SD 0.58) mmol/l and 1.4 (SD 0.63) mmol/l in men (Figure 2, panel B). Total cholesterol was 4.7 (SD 0.98) mmol/l in women and 4.8 (SD 1.1) mmol/l in men (Figure 2, panel C).
Of the 310 women, 204 (65.8%) were considered in euglycemia, 94 (30.3%) in prediabetes state, and 12 (3.9%) had diabetes-like values. Regarding triglycerides, 255 women (82.3%) were considered within desirable values, 39 (12.6%) were borderline, and 16 (5.2%) high. Total cholesterol, 111 women (35.8%) in optimal values, 113 (36.5%) in mid values, and 86 (27.7%) in high.
In the 120 men, 61 (50.8%) were considered in euglycemia, 48 (40%) had prediabetes state-like values, and 11 (9.2%) were considered diabetic. For triglycerides determination, 88 (73.3%) were considered within desirable values, 19 (15.8%) were borderline, and 13 (10.8%) high. For total cholesterol, 41 (34.2%) were considered within desirable values, 39 (32.5%) were borderline, and 40 (33.3%) high.
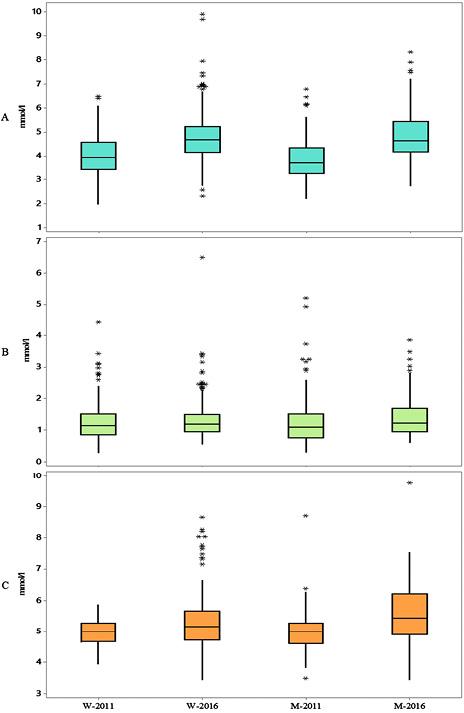
Figure 2. Glucemia, tryglicerides and total colesterol boxplots. W = women. M = men. Panel A. Glucose. Significant differences in women (W-2011 and W-2016 t = -4.582, p = 0.0001) and men (M-2011 and M-2016, t = -6.428, p = 0.0001). Panel B, tryglicerides. There were no significant differences. Panel C, total cholesterol. Significant differences in women (W-2011 and W-2016 t = -9.124, p = 0.0001) and men (M-2011 and M-2016, t = -9.499, p = 0.0001). Source: own data.
Pearson test revealed a correlation in women for glucose-triglycerides, r = 0.276 (p < 0.0001); glucose-total cholesterol, r = 0.457 (p < 0.0001); and triglycerides-cholesterol, r = 0.261 (p < 0.0001). In men, a correlation was found for glucose-triglycerides, r = 0.186 (p = 0.042); glucose-total cholesterol, r = 0.526 (p < 0.0001); and triglycerides-total cholesterol, r = 0.181 (p = 0.048). Student’s t-test revealed a difference between women and men in glucose means, t = 3.373, p = 0.001, which was not found in either triglycerides or total cholesterol.
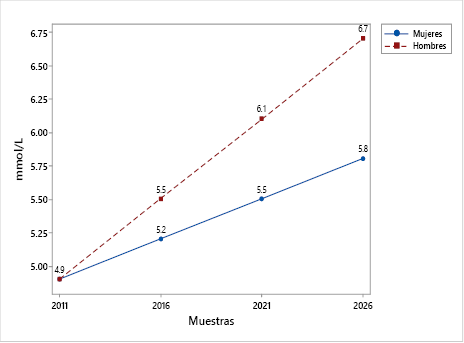
Figure 3. Forecast of the variation of means. Women, blue circles. Men, red squares. If the trend continues, it could be expected that by 2021 the average in women will be the cut-off limit for prediabetes. For men, the average would be in line with the cutoff for diabetes in 2026. Source: own data.
Comparison between the 2011 and 2016 samples. Student’s t-test revealed significant differences in women, between the 2011 and the 2016 samples, in glucose, t = -4.582 (p < 0.0001) and total cholesterol, t = -9.124 (p < 0.0001). For the samples of men, differences were also found in glucose, t = -6.428 (p < 0.0001) and total cholesterol, t = -9.499 (p < 0.0001). When comparing the youth according to clinical criteria for hyperglycemia and hypercholesterolemia, a higher proportion of individuals, both women and men, in prediabetes state and borderline for total cholesterol was found.
Since the analysis was made with only two data, the mean absolute percentage error was zero; this was found with the mean square deviation (Figure 3). Being homogeneous groups in age, there were no differences in the proportions of individuals in eutrophy, overweight or with obesity between both samples and there was no correlation between BMI with fasting blood glucose, it could not be modeled the probability that a given individual had preDM2 or DM2 according to your body mass or age.
Discussion
Glucose, triglycerides, and cholesterol values were analyzed in samples of newly enrolled students to the university, predominating those of 18 years of age. As has been observed in larger studies on glucose [7], the tendency is that individual values and, hence, averages displace toward the right. Therefore, the values of the samples from the 430 students of 2016 reveal a larger number of individuals above the limit for prediabetes, with only 65.8% and 50.8% within desirable fasting values (Figure 2, panel A).
This contrasts with the 2011 sample, in which 79.9% of women and 87% of men were in euglycemia. Data of 2016 are higher than those estimated for the general population of the USA, where the existence of 86 million people with prediabetes is considered for 2017; more than one out of every three adult inhabitants of that country [10]. However, these data are consistent with the latest data on diabetes prevalence in Mexico: 4.6% in 2000 and 7.4% in 2006 [11].
The displacement toward the right of the glucose values described in the literature and these results in the young population speak against the idea that the increase in prediabetes and diabetes is associated with older age. These data rather seem to support that changes in the diet toward a higher consumption of added sugars are responsible for modifications in the metabolic profile, which start as a low-grade inflammation at early ages [12]. In this sense, the foods served at the school cafeterias in the region seem to contribute to the problem rather than providing a solution, because of the bad quality of the food [13].
If the increment in the prevalence of diabetes corresponds to the genetic load, it seems that the environment is the one to have an effect on genes and not that the genes express in the form of diabetes. This is because the age of the participants of this sample is much lower than that estimated by the projections as the regular starting age for T2DM, i.e., 45 years [14].
The displacement toward the right of the cholesterol values (Figure 2, panel C) is a phenomenon that has been observed in this region for decades. Results from a Framingham survey performed in 1993 in this same geographic area revealed that 32% of women and 30% of men older than 20 years were at risk for developing atherosclerosis [15]. Because this is a biomarker hard to modify by fasting, it can be measured even in post-prandial conditions. Results showed consistency with the global tendency [8]. The main cause for hypercholesterolemia could also be the consumption of poor quality diets, rich in fructose [16-18], as has been found for the youngsters of this region [19]. The similarities among the triglycerides values (Figure 2, panel B) provides support that the participants did fast for the requested period before collecting their blood samples for the clinical laboratory determinations.
It is a non-probabilistic investigation and in a specific geographic space, so the data cannot be generalized, however, they are relevant, since the findings are similar to those of the literature at the graduate level of education [20-22]. Moreover, the data from prediabetes state were consistent with the insulin resistance data found in groups of children and adolescents in other environments and school levels, with 25% and 27% of affected participants [23-26]. These children and adolescents could maintain this condition in adulthood, which would explain that it is found in important proportions in university populations [20-22]. The participants of this research, as is the case of others carried out in university environments, possibly show the effects of the environment on biomarkers whose modifications correspond to the main causes of burden due to illness and death in the world. This was not a study about patterns of food consumption. But either because it is not part of the curriculum, the educational processes are not developed as projects to be applied in a context or because there are no adequate spaces, students do not build healthy behaviors [25].
Another barrier, perhaps the most important one, is the scarce training that is achieved during the processes of undergraduate education and even in the faculties of health sciences. In the United States, only 27% of medical schools cover a minimum of 25 hours of a course on food, which is a recommendation of the National Academy of Sciences of that country [26]. The integration of capacities to provide practical advice towards a healthy lifestyle requires transformations in education for healthy eating, including in the form of cooking workshops [27-29].
Conclusions
The results showed an increase in fasting blood glucose values in samples of new students entering higher education in health sciences, which brings the average of individual values towards the limit of cut for prediabetes state.
The variations of the values between the samples that were analyzed from new income groups in 2011 and 2016 showed a tendency that in the worst-case scenario means an increase in the cases of DM2 in younger and younger patients, which contrasts with the idea that the aging of the population is a relevant factor.
The results support the need to request laboratory tests to identify modifications in biomarkers to initiate non-pharmacological or pharmacological treatments in their case with young patients with preT2DM and T2DM.
Education towards healthy lifestyles is an area of opportunity in higher education, especially in health sciences. The learning for the preparation of the food must have the purpose of laying the foundations of considering that the food has a process of elaboration that not only results in the texture and the flavor, but in the concept of “thinking the food as a whole” not only for self-care, but also for patients.
Acknowledgements
For the personnel of the clinical analysis laboratory of the Tabasco’s Juarez Autonomous University.
Conflict of Interest: the authors have no conflict of interest.
Sources of financing: this work is part of a project supported by the Research Strengthening Program of the Tabasco’s Juarez Autonomous University, PFI-DACS-2015-08.
Literature cited
1. Lozano R, Gómez-Dantés H, Garrido-Latorre F, Jiménez-Corona A, Campuzano Rincón JC, Franco- Marina F, et al. Burden of disease, injuries, risk factors and challenges for the health system in Mexico. Salud Pública Mex 2013; 55:580-94.
2. Phillips LS, Ratner RE, Buse JB, Kahn SE. We can change the natural history of type 2 diabetes. Diabetes Care 2014; 37(10):2668-76. DOI: 10.2337/ dc14-0817.
3. National Public Health Institute. Midway Mexican National Health and Nutrition Survey 2016. México D.F.: Health Secretariat, México; 2016.
4. Kontis V, Mathers CD, Rehm J, Stevens GA, Shield KD, Bonita R, et al. Contribution of six risk fac- tors to achieving the 25×25 non-communicable disease mortality reduction target: a model- ling study. Lancet 2014; 384(9941):427-37. DOI: 10.1016/S0140-6736(14)60616-4.
5. Mozaffarian D, Appel LJ, Van Horn L. Components of a cardioprotective diet: new insights. Circu- lation 2011; 123:2870-91. DOI: 10.1161/CIRCULA- TIONAHA.110.968735.
6. DeFronzo RA, Tripathy D. Skeletal muscle insulin resistance is the primary defect in type 2 diabe- tes. Diabetes Care 2009; 32(suppl 2):S157-S63. DOI: 10.2337/dc09-S302.
7. Danaei G, Finucane MM, Lu Y, Singh GM, Cowan MJ, Paciorek CJ, et al. National, regional, and global trends in fasting plasma glucose and diabetes prevalence since 1980: systematic anal- ysis of health examination surveys and epidemi- ological studies with 370 country-years and 2·7 million participants. Lancet 2011; 378(9785):31-40. DOI: 10.1016/S0140-6736(11)60679-X .
8. Farzadfar F, Finucane MM, Danaei G, Pelizzari PM, Cowan MJ, Paciorek CJ, et al. National, regional, and global trends in serum total cholesterol since 1980: systematic analysis of health exam- ination surveys and epidemiological studies with
321 country-years and 3.0 million participants. Lancet 2011; 377:578-86. DOI: 10.1016/S0140-
6736(10)62038-7.
9. Muñoz-Cano JM, Hernández JA, Mayo H, Boldo X. Pre-diabetes and diabetes without association with overweight or obesity in Mexican youth. Arch Lat Nutr 2013; 63(2):148-56.
10. American Diabetes Association [Internet]. 1 in 3
American adults has prediabetes. Do you? [updated
2018; cited 2018 Jul 13]. Available from: https:// doihaveprediabetes.org/?loc=dorg_201707_en_ feat_adcounci
11. Federación Mexicana de Diabetes [Internet]. Dia- betes in México. [updated 2017; cited 2018 Jul
13]. Available from: http://fmdiabetes.org/diabetes- en-mexico/
12. González-Gil EM, Tognon G, Lissner L, Intemann T, Pala V, Galli C et al. Prospective associations between dietary patterns and high sensitivity C-reactive protein in European children: the IDEFICS study. Eur J Nutr 2018;57(4):1397-407. DOI: 10.1007/s00394-017-1419-x.
13. Salem C, Muñoz J. Differences in the composition of Tabasco’s traditional food dishes and fast food in university cafeterias. Rev Educ Cienc Salud 2016;13 (1): 28-32.
14. King H, Aubert RE, Herman WH. Global burden of diabetes, 1995–2025: prevalence, numerical estimates, and projections. Diabetes Care 1998;
21(9): 1414-31.
15. Muñoz-Cano JM, Cortés-Peñaloza JL, Díaz-Montero L. Levels of high density protein and the risk of atherosclerosis. Salud Publica Mex 1993; 35(6):
637-41.
16. Caliceti C, Calabria D, Roda A, Cicero AF. Fructose intake, serum uric acid, and cardiometabolic dis- orders: a critical review. Nutrients 2017; 9(4):395.
17. Chun S, Choi Y, Chang Y. Soft drinks increase the risk for coronary atherosclerosis. Am Heart J 2016;177:17-24. DOI: 10.3390/nu9040395
18. Kolderup A, Svihus B. Fructose metabolism and relation to atherosclerosis, type 2 diabetes, and obesity. J Nutr Metab 2015;ID 823081. DOI: http:// dx.doi.org/10.1155/2015/823081
19. Munoz-Cano JM, Cordova-Hernandez JA, del Val- le-Laveaga D. The healthy eating index of new students at a university of Mexico. Nutr Hosp 2015; 31(4):1582-8.
20. Escalante EM, Cerda EM, Morales JM. Prevalence of pre-diabetes in the Universidad Autónoma de San Luis Potosí aspiring young. Bioquimia 2009;34(1):126.
21. Muñoz-Cano JM, Maldonado-Salazar T. Nutritional health message content in primary school text- books. Rev Comunicación Salud 2013; 3(1):19-33.
22. Herencia K, Hernández M, Moreno J. Determina- tion of the resistance to insulin in young adults with increase in body weight in a public school of medicine. Rev Med Panacea 2015; 5(1):4-10.
23. Rentfro AR, Nino JC, Pones RM, Innis-Whitehouse W, Barroso CS, Rahbar MH. Adiposity, biological markers of disease, and insulin resistance in Mexican American adolescents, 2004-2005. Prev Chronic Dis 2011; 8(2):40.
24. Mendoza EY, Zavala V, Sánchez MV, López-Correa SM, Carranza J. Detection of diabetes mellitus in adolescents with overweight and obesity. Med Int Méx 2016; 32(1):9-13.
25. Wynn K, Trudeau JD, Taunton K, Gowans M, Scott I. Nu- trition in primary care. Current practices, attitudes, and barriers. Can Fam Physician 2010; 56(3):e109-16
26. Healthy Schools Campaing [Internet]. Eng M. Cook- ing up change in American schools. [updated
2015; cited 2018 Jul 13]. Available from: https:// healthyschoolscampaign.org/programs/national/ cooking-up-change-national/
27. Eisenberg DM, Burgess JD. Nutrition education in an era of global obesity and diabetes: Thinking outside the box. Acad Med 2015; 90(7):854-60. DOI: 10.1097/ACM.0000000000000682
28. Salinas J, González CG, Fretes G, Montenegro E, Vio del RF. Theoretical and methodological basis for a healthy food educational program in chilean basic schools. Rev Chil Nutr 2014;
41(4):343-50. DOI: http://dx.doi.org/10.4067/S0717-
75182014000400001 .
29. Mozaffarian D. Foods, obesity, and diabetes—are all calories created equal? Nutrition Reviews 2016; 75(S1): 19-31. DOI: 10.1093/nutrit/nuw024.
![]()